Filtered by Web development

Page 4

Reset

Experimenting with Nginx worker_processes

February 14, 2019
0 comments Web development, Nginx, macOS, Linux

I have Nginx 1.15.8 installed with Homebrew on my macOS. By default the /usr/local/etc/nginx/nginx.conf it set to...:

worker_processes  1;

But, from the documentation, it says:

"The optimal value depends on many factors including (but not limited to) the number of CPU cores, the number of hard disk drives that store data, and load pattern. When one is in doubt, setting it to the number of available CPU cores would be a good start (the value “auto” will try to autodetect it)." (bold emphasis mine)

What is the ideal number for me? The performance of Nginx on my laptop doesn't really matter. But for my side-projects it's important to have a fast Nginx since it serves static HTML and lots of static assets. However, on my personal servers I have a bunch of other resource hungry stuff going on that I know is more likely to need the resources, like Elasticsearch and uwsgi.

To figure this out, I wrote a benchmark program that requested a small index.html about 10,000 times across 10 concurrent clients with hey.

hey -n 10000 -c 10 http://peterbecom.local/plog/variable_cache_control/awspa

I ran this 10 times between changing the worker_processes in the nginx.conf file. Here's the output:

1 WORKER PROCESSES
BEST  : 13,607.24 reqs/s

2 WORKER PROCESSES
BEST  : 17,422.76 reqs/s

3 WORKER PROCESSES
BEST  : 18,886.60 reqs/s

4 WORKER PROCESSES
BEST  : 19,417.35 reqs/s

5 WORKER PROCESSES
BEST  : 19,094.18 reqs/s

6 WORKER PROCESSES
BEST  : 19,855.32 reqs/s

7 WORKER PROCESSES
BEST  : 19,824.86 reqs/s

8 WORKER PROCESSES
BEST  : 20,118.25 reqs/s

Or, as a graph:

Graph

Now note, this is done here on my MacBook Pro. Not on my Ubuntu DigitalOcean servers. For now, I just want to get a feeling for how these numbers correlate.

Conclusion

The benchmark isn't good enough. The numbers are pretty stable but I'm doing this on my laptop with multiple browsers idling, Slack, and Spotify running. Clearly, the throughput goes up a bit when you allocate more workers but if anything can be learned from this, start with going beyond 1 for a quick fix and from there start poking and more exhaustive benchmarks. And don't forget, if you have time to go deeper on this, to look at the combination of worker_connections and worker_processes.

create-react-app, SCSS, and Bulmaswatch

February 12, 2019
2 comments Web development, React, JavaScript

1. Create a create-react-app first:

create-react-app myapp

2. Enter it and install node-sass and bulmaswatch

cd myapp
yarn add bulma bulmaswatch node-sass

3. Edit the src/index.js to import index.scss instead:


-import "./index.css";
+import "./index.scss";

4. "Rename" the index.css file:

git rm src/index.css 
touch src/index.scss
git add src/index.scss

5. Now edit the src/index.scss to look like this:


@import "node_modules/bulmaswatch/darkly/bulmaswatch";

This assumes your favorite theme was the darkly one. You can obviously change that later.

6. Run the app:

BROWSER=none yarn start

7. Open the browser at http://localhost:3000

CRA start

That's it! However, the create-react-app default look doesn't expose any of the cool stuff that Bulma can style. So let's rewrite our src/App.js by copying the minimal starter HTML from the Bulma documentation. So make the src/App.js component look something like this:


class App extends Component {
  render() {
    return (
      <section className="section">
        <div className="container">
          <h1 className="title">Hello World</h1>
          <p className="subtitle">
            My first website with <strong>Bulma</strong>!
          </p>
        </div>
      </section>
    );
  }
}

Now it'll look like this:

Bulma starter template

Yes, it's not much but it's a great start. Over to you to take this to infinity and beyond!

Not So Secret Sauce

In the rushed instructions above the choice of theme was darkly. But what you need to do next is go to https://jenil.github.io/bulmaswatch/, click around and eventually pick the one you like. Suppose you like spacelab, then you just change that @import ... line to be:


@import "node_modules/bulmaswatch/spacelab/bulmaswatch";

TEMPORARY:

h1 {  
    color: red;
    font-size: 5em;
}

TEST CHANGE 3.

Optimize DOM selector lookups by pre-warming by selectors' parents

February 11, 2019
0 comments Web development, Node, Web Performance, JavaScript

tl;dr; minimalcss 0.8.2 introduces a 20% post-processing optimization by lumping many CSS selectors to their parent CSS selectors as a pre-emptive cache.

In minimalcss the general core of it is that it downloads a DOM tree, as HTML, parses it and parses all the CSS stylesheets associated. These might be from <link ref="stylesheet"> or <style> tags.
Once the CSS stylesheets are turned into an AST it loops over each and every CSS selector and asks a simple question; "Does this CSS selector exist in the DOM?". The equivalent is to open your browser's Web Console and type:

>>> document.querySelectorAll('div.foo span.bar b').length > 0
false

For each of these lookups (which is done with cheerio by the way), minimalcss reduces the CSS, as an AST, and eventually spits the AST back out as a CSS string. The only problem is; it's slow. In the case of view-source:https://semantic-ui.com/ in the CSS it uses, there are 6,784 of them. What to do?

First of all, there isn't a lot you can do. This is the work that needs to be done. But one thing you can do is be smart about which selectors you look at and use a "decision cache" to pre-emptively draw conclusions. So, if this is what you have to check:

  1. #example .alternate.stripe
  2. #example .theming.stripe
  3. #example .solid .column p b
  4. #example .solid .column p

As you process the first one you extract that the parent CSS selector is #example and if that doesn't exist in the DOM, you can efficiently draw conclusion about all preceeding selectors that all start with #example .... Granted, if they call exist you will pay a penalty of doing an extra lookup. But that's the trade-off that this optimization is worth.

Check out the comments where I tested a bloated page that uses Semantic-UI before and after. Instead of doing 3,285 of these document.querySelector(selector) calls, it's now able too come to the exact same conclusion with just 1,563 lookups.

Sadly, the majority of the time spent processing lies in network I/O and other overheads but this work did reduce something that used to take 6.3s (median) too 5.1s (median).

Displaying fetch() errors and unwanted responses in React

February 6, 2019
0 comments Web development, React, JavaScript

tl;dr; You can use error instanceof window.Response to distinguish between fetch exceptions and fetch responses.

When you do something like...


const response = await fetch(URL);

...two bad things can happen.

  1. The XHR request fails entirely. I.e. there's not even a response with a HTTP status code.
  2. The response "worked" but the HTTP status code was not to your liking.

Either way, your React app needs to deal with this. Ideally in a not-too-clunky way. So here is one take on this challenge/opportunity which I hope can inspire you to extend it the way you need it to go.

The trick is to "clump" exceptions with responses. Then you can do this:


function ShowServerError({ error }) {
  if (!error) {
    return null;
  }
  return (
    <div className="alert">
      <h3>Server Error</h3>
      {error instanceof window.Response ? (
        <p>
          <b>{error.status}</b> on <b>{error.url}</b>
          <br />
          <small>{error.statusText}</small>
        </p>
      ) : (
        <p>
          <code>{error.toString()}</code>
        </p>
      )}
    </div>
  );
}

The greatest trick the devil ever pulled was to use if (error instanceof window.Reponse) {. Then you know that error thing is the outcome of THIS = await fetch(URL) (or fetch(URL).then(THIS) if you prefer). Another good trick the devil pulled was to be aware that exceptions, when asked to render in React does not naturally call its .toString() so you have to do that yourself with {error.toString()}.

This codesandbox demonstrates it quite well. (Although, at the time of writing, codesandbox will spew warnings related to testing React components in the console log. Ignore that.)

If you can't open that codesandbox, here's the gist of it:


React.useEffect(() => {
  url &&
    (async () => {
      let response;
      try {
        response = await fetch(url);
      } catch (ex) {
        return setServerError(ex);
      }
      if (!response.ok) {
        return setServerError(response);
      }
      // do something here with `await response.json()`
    })(url);
}, [url]);

By the way, another important trick is to be subtle with how you put the try { and } catch(ex) {.


// DON'T DO THIS

try {
  const response = await fetch(url);
  if (!response.ok) {
    setServerError(response);
  }
  // do something here with `await response.json()`
} catch (ex) {
  setServerError(ex);
}

Instead...


// DO THIS

let response;
try {
  response = await fetch(url);
} catch (ex) {
  return setServerError(ex);
}
if (!response.ok) {
  return setServerError(response);
}
// do something here with `await response.json()`

If you don't do that you risk catching other exceptions that aren't exclusively the fetch() call. Also, notice the use of return inside the catch block which will exit the function early leaving you the rest of the code (de-dented 1 level) to deal with the happy-path response object.

Be aware that the test if (!response.ok) is simplistic. It's just a shorthand for checking if the "status in the range 200 to 299, inclusive". Realistically getting a response.status === 400 isn't an "error" really. It might just be a validation error hint from a server, and likely the await response.json() will work and contain useful information. No need to throw up a toast or a flash message that the communication with the server failed.

Conclusion

The details matter. You might want to deal with exceptions entirely differently from successful responses with bad HTTP status codes. It's nevertheless important to appreciate two things:

  1. Handle complete fetch() failures and feed your UI or your retry mechanisms.

  2. You can, in one component distinguish between a "successful" fetch() call and thrown JavaScript exceptions.

Concurrent download with hashin without --update-all

December 18, 2018
0 comments Web development, Python

Last week, I landed concurrent downloads in hashin. The example was that you do something like...


$ time hashin -r some/requirements.txt --update-all

...and the whole thing takes ~2 seconds even though it that some/requirements.txt file might contain 50 different packages, and thus 50 different PyPI.org lookups.

Just wanted to point out, this is not unique to use with --update-all. It's for any list of packages. And I want to put some better numbers on that so here goes...

Suppose you want to create a requirements file for every package in the current virtualenv you might do it like this:


# the -e filtering removes locally installed packages from git URLs
$ pip freeze | grep -v '-e ' | xargs hashin -r /tmp/reqs.txt

Before running that I injected a little timer on each pypi.org download. It looked like this:


def get_package_data(package, verbose=False):
    url = "https://pypi.org/pypi/%s/json" % package
    if verbose:
        print(url)
+   t0 = time.time()
    content = json.loads(_download(url))
    if "releases" not in content:
        raise PackageError("package JSON is not sane")
+   t1 = time.time()
+   print(t1 - t0)

I also put a print around the call to pre_download_packages(lookup_memory, specs, verbose=verbose) to see what the "total time" was.

The output looked like this:

▶ pip freeze | grep -v '-e ' | xargs python hashin.py -r /tmp/reqs.txt
0.22896194458007812
0.2900810241699219
0.2814369201660156
0.22658205032348633
0.24882292747497559
0.268247127532959
0.29332590103149414
0.23981380462646484
0.2930259704589844
0.29442572593688965
0.25312376022338867
0.34232664108276367
0.49491214752197266
0.23823285102844238
0.3221290111541748
0.28302812576293945
0.567702054977417
0.3089122772216797
0.5273139476776123
0.31477880477905273
0.6202089786529541
0.28571176528930664
0.24558186531066895
0.5810830593109131
0.5219211578369141
0.23252081871032715
0.4650228023529053
0.6127192974090576
0.6000659465789795
0.30976200103759766
0.44440698623657227
0.3135409355163574
0.638585090637207
0.297544002532959
0.6462509632110596
0.45389699935913086
0.34597206115722656
0.3462028503417969
0.6250648498535156
0.44159507751464844
0.5733060836791992
0.6739277839660645
0.6560370922088623
SUM TOTAL TOOK 0.8481268882751465

If you sum up all the individual times it would have become 17.3 seconds. It's 43 individual packages and 8 CPUs multiplied by 5 means it had to wait with some before downloading the rest.

Clearly, this works nicely.

How I performance test PostgreSQL locally on macOS

December 10, 2018
2 comments Web development, macOS, PostgreSQL

It's weird to do performance analysis of a database you run on your laptop. When testing some app, your local instance probably has 1/1000 the amount of realistic data compared to a production server. Or, you're running a bunch of end-to-end integration tests whose PostgreSQL performance doesn't make sense to measure.

Anyway, if you are doing some performance testing of an app that uses PostgreSQL one great tool to use is pghero. I use it for my side-projects and it gives me such nice insights into slow queries that I'm willing to live with the cost that it is to run it on a production database.

This is more of a brain dump of how I run it locally:

First, you need to edit your postgresql.conf. Even if you used Homebrew to install it, it's not clear where the right config file is. Start psql (on any database) and type this to find out which file is the one:


$ psql kintobench

kintobench=# show config_file;
               config_file
-----------------------------------------
 /usr/local/var/postgres/postgresql.conf
(1 row)

Now, open /usr/local/var/postgres/postgresql.conf and add the following lines:

# Peterbe: From Pghero's configuration help.
shared_preload_libraries = 'pg_stat_statements'
pg_stat_statements.track = all

Now, to restart the server use:


▶ brew services restart postgresql
Stopping `postgresql`... (might take a while)
==> Successfully stopped `postgresql` (label: homebrew.mxcl.postgresql)
==> Successfully started `postgresql` (label: homebrew.mxcl.postgresql)

The next thing you need is pghero itself and it's easy to run in docker. So to start, you need Docker for mac installed. You also need to know the database URL. Here's how I ran it:

docker run -ti -e DATABASE_URL=postgres://peterbe:@host.docker.internal:5432/kintobench -p 8080:8080 ankane/pghero

Duplicate indexes

Note the trick of peterbe:@host.docker.internal because I don't use a password but inside the Docker container it doesn't know my terminal username. And the host.docker.internal is so the Docker container can reach the PostgreSQL installed on the host.

Once that starts up you can go to http://localhost:8080 in a browser and see a listing of all the cumulatively slowest queries. There are other cool features in pghero too that you can immediately benefit from such as hints about unused/redundent database indices.

Hope it helps!

React 16.6 with Suspense and lazy loading components with react-router-dom

October 26, 2018
7 comments Web development, JavaScript, React

If you're reading this, you might have thought one of two thoughts about this blog post title (or both); "Cool buzzwords!" or "Yuck! So much hyped buzzwords!"

Either way, React v16.6 came out a couple of days ago and it brings with it React.lazy: Code-Splitting with Suspense.

React.lazy is React's built-in way of lazy loading components. With Suspense you can make that lazy loading be smart and know to render a fallback component (or JSX element) whilst waiting for that slowly loading chunk for the lazy component.

The sample code in the announcement was deliciously simple but I was curious; how does that work with react-router-dom??

Without furher ado, here's a complete demo/example. The gist is an app that has two sub-components loaded with react-router-dom:


<Router>
  <div className="App">
    <Switch>
      <Route path="/" exact component={Home} />
      <Route path="/:id" component={Post} />
    </Switch>
  </div>
</Router>

The idea is that the Home component will list all the blog posts and the Post component will display the full details of that blog post. In my demo, the Post component never bothers to actually do the fetching of the full details to display. It just displays the passed in ID from the react-router-dom match prop. You get the idea.

That's standard React with react-router-dom stuff. Next up, lazy loading. Basically, instead of importing the Post component, you make it lazy:


-import Post from "./post";
+const Post = React.lazy(() => import("./post"));

And here comes the magic sauce. Instead of referencing component={Post} in the <Route/> you use this badboy:


function WaitingComponent(Component) {
  return props => (
    <Suspense fallback={<div>Loading...</div>}>
      <Component {...props} />
    </Suspense>
  );
}

Complete prototype

The final thing looks like this:


import React, { lazy, Suspense } from "react";
import ReactDOM from "react-dom";
import { MemoryRouter as Router, Route, Switch } from "react-router-dom";

import Home from "./home";
const Post = lazy(() => import("./post"));

function App() {
  return (
    <Router>
      <div className="App">
        <Switch>
          <Route path="/" exact component={Home} />
          <Route path="/:id" component={WaitingComponent(Post)} />
        </Switch>
      </div>
    </Router>
  );
}

function WaitingComponent(Component) {
  return props => (
    <Suspense fallback={<div>Loading...</div>}>
      <Component {...props} />
    </Suspense>
  );
}

const rootElement = document.getElementById("root");
ReactDOM.render(<App />, rootElement);

(sorry about the weird syntax highlighting with the red boxes.)

And it totally works! It's hard to show this with the demo but if you don't believe me, you can download the whole codesandbox as a .zip, run yarn && yarn run build && serve -s build and then you can see it doing its magic as if this was the complete foundation of a fully working client-side app.

1. Loading the "Home" page, then click one of the links

Loading the "Home" page

2. Lazy loading the Post component

Lazy loading the Post component

3. Post component lazily loaded once and for all

Post component lazily loaded once and for all

Bonus

One thing that can happen is that you might load the app when the Wifi is honky dory but when you eventually make a click that causes a lazy loading to actually need to go out on the Internet and download that .js file it might fail. For example, because the file has been removed from the server or your network just fails for some reason. To deal with that, simply wrap the whole <Suspense> component in an error boundary component.

See this demo which is a fork of the main demo but with error boundaries added.

In conclusion

No surprise that it works. React is pretty awesome. I just wasn't sure how it would look like with react-router-dom.

A word of warning, from the v16.6 announcement: "This feature is not yet available for server-side rendering. Suspense support will be added in a later release."

I think lazy loading isn't actually that big of a deal. It's nice that it works but how likely is it really that you have a sub-tree of components that is so big and slow that you can't just pay for it up front as part of one big fat build. If you really care about a really great web performance for those people who reach your app rarely and sporadically, the true ticket to success is server-side rendering and shipping a gzipped HTML document with all the React client-side code non-blocking rendering so that the user can download the HTML, start reading/consuming it immediately and then whilst the user is doing that you download the rest of the .js that is going to be needed once the user clicks around. Start there.

How much HTML is too much for optimal web performance

October 17, 2018
4 comments Web development, Web Performance

Right off the bat; I don't know. All I know is that it's complicated.

I have this page which is just a blog post page. It's entirely rendered on the server, comments and all. At the time of writing, the total size of the HTML document is 119KB (30KB gzipped). If you remove all the comments, which makes up the bulk of the HTML it reduces down to 31KB (7KB gzipped). Fair enough. That's 23KB less to download. But, does it matter (much)?

Downloading

First of all, I noticed this:
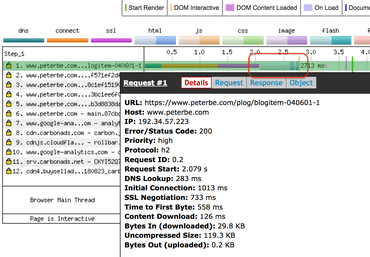
Waterfall
WebPagetest with iPhone 6, 4G on the same US coast as the datacenter

That's a WebPagetest using iPhone 6 on 4G and, lemme emphasize this, it took 126ms to download the HTML document. If you subtract "DNS Lookup" (283ms), "Initial Connection" (1013ms), and "SSL Negotiation" (733ms) it took 684ms serve the file, download it, and parse it. Remember, this is all on 4G. Pretty fast. In conclusion, it's probably not too much HTML in that page to download. This downloadingness is fraction of the total "web performance cost". Let's dig deeper.

Note! With WebPagetest all those numbers like DNS Lookup, Initial Connection and SSL Negotiation are wildly unpredictable between tests. Chances are, the numbers are very different the next time you run a test using the exact same input. Who knows. Deep internet plumbings beyond the control of WebPagetest.

Note! I ran it one more time with the exact same parameters and this time it was 535ms (instead of 684ms) to serve, download, and parse.

Parsing & layout

Parsing is hard to measure but here's what I found when using the Google Chrome dev tools:

Google Chrome Performance devtools

It says it took...

  • parsed HTML - 94ms
  • recalculate style - 43ms
  • layout - 386ms

That's half a second just loading and rendering. Definitely sucks. But note, this test uses 4x CPU slowdown and 3G simulation. So perhaps it's not so bad.

Let's try again with a smaller HTML document

So I butchered up a hybrid version that has almost the same HTML except all but 1 of those 166'ish div.comment DOM nodes. It's now 31KB (7KB gzipped´) to download instead of 119KB (30KB gzipped).

Same WebPagetest parameters but now this this smaller HTML document:
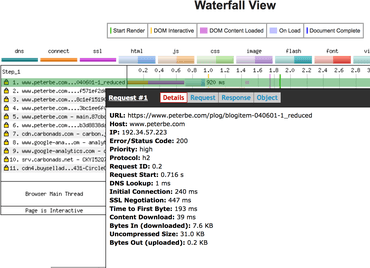
WebPagetest with a much smaller HTML footprint

Now it says it only took 39ms to download and 232ms (it was 684ms before) to serve the file, download it, and parse it. Interesting!

Note! I ran it one more time with exact same parameters and this time it was 237ms (instead of 232ms) to serve, download, and parse.

Clearly it's working. The smaller the HTML document the faster it performs. No surprise. But stick around for the conclusion.

Parsing & layout with a smaller HTML document

Check this out:
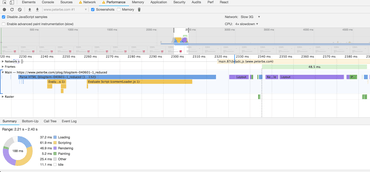
Google Chrome Performance devtools (smaller HTML document)

It says it took...

  • parsed HTML - 91ms
  • recalculate style - 6ms
  • layout - 29ms

Mind you, all of these numbers are at the mercy of what my laptop is up to at the moment as it can affect Chrome's rendering if it has, at that moment, less (or more) access to CPU and memory caching.

Either way, it parses + layout in 126ms instead of 523ms for the larger HTML document.

Side-by-side

The best test to see how much faster the smaller HTML document variant is, is to compare them side-by-side. It looks like this:
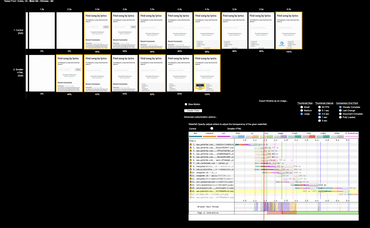
Side-by-side
Visual comparison on WebPagetest (using 4G)

Two major takeaways from this:

  1. The smaller HTML version starts rendering half a second before the original one.
  2. The complete time favors the smaller HTML version by 2.5 seconds but that's possibly influenced by the ads that load more than any slow layout rendering.
  3. This is using 4G which isn't unheard of but definitely much less common than better speeds.

Here they are compared on "Desktop" which appears to give the smaller HTML version a 0.2 second advantage:
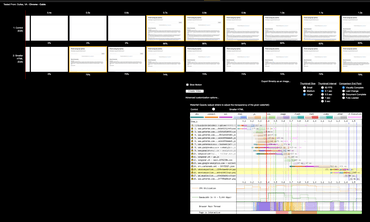
Visual comparison on WebPagetest (using "Desktop")

And here are the Lighthouse reports side-by-side:
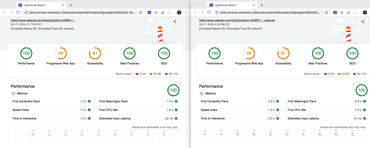
Lighthouses
Side-by-side using Lighthouse

Discussion

The above concludes rather unsurprisingly that a smaller HTML footprint downloads, parses and lays out quicker.

The killer reason that page is so large, with all those comments rendered in the original HTML is simple: SEO. Google loves comments because comments indicate that the page is thriving and a place where people go, spend time, and stick around. I've experimented with this in the past and found that if I make the HTML document smaller (or loading the rest after document load) the SEO takes a big hit. Yes, Google's bot renders with JavaScript but not always and even if it does, I assume it's smart enough to appreciate that content that is loaded (async or post-DOMContentLoad) is less important and thus not what the page is about.

Regarding SEO, we know that Google loves fast sites. Especially for mobile. But content is still king my gut tells me. Left as an exercise to the reader to take a stand on this.

Another problem with lazy loading the comments (or whatever else might be applicable to your site) is that it might cause "flicker". I put that word in quote because sometimes flicker is literally visual flicker and sometimes it's moments of browser sluggishness. The XHR request and the subsequent post-rendering will cause a bunch of work that strains the browser and might make it unpleasant when your eyes and brain is in the midst of committing to consuming it.

Basically, there are significant real benefits of not trying to squeeze every little millisecond out by making the HTML smaller upfront. Remember the fact that the "smaller HTML" version in this test is drastic. I butchered it from 119KB to 31KB which might be so drastic that it's not necessarily applicable at all. In other words, had I reduced the HTML size by just 20% it might not even register on the performance graph but could be significant in terms SEO keywords.

Conclusion

The majority of the time spend making a web page useful to a user is a sum of all sorts of metrics. The size of the HTML document does matter but remember that it's just one of multiple aspects to watch out for.

In conclusion, it's complicated and depends on your needs and context. I hope you can benefit a little bit from the metrics above.

Fancy linkifying of text with Bleach and domain checks (with Python)

October 10, 2018
2 comments Python, Web development

Bleach is awesome. Thank you for it @willkg! It's a Python library for sanitizing text as well as "linkifying" text for HTML use. For example, consider this:

>>> import bleach
>>> bleach.linkify("Here is some text with a url.com.")
'Here is some text with a <a href="http://url.com" rel="nofollow">url.com</a>.'

Note that sanitizing is separate thing, but if you're curious, consider this example:

>>> bleach.linkify(bleach.clean("Here is <script> some text with a url.com."))
'Here is &lt;script&gt; some text with a <a href="http://url.com" rel="nofollow">url.com</a>.'

With that output you can confidently template interpolate that string straight into your HTML.

Getting fancy

That's a great start but I wanted a more. For one, I don't always want the rel="nofollow" attribute on all links. In particular for links that are within the site. Secondly, a lot of things look like a domain but isn't. For example This is a text.at the start which would naively become...:

>>> bleach.linkify("This is a text.at the start")
'This is a <a href="http://text.at" rel="nofollow">text.at</a> the start'

...because text.at looks like a domain.

So here is how I use it here on www.peterbe.com to linkify blog comments:


def custom_nofollow_maker(attrs, new=False):
    href_key = (None, u"href")

    if href_key not in attrs:
        return attrs

    if attrs[href_key].startswith(u"mailto:"):
        return attrs

    p = urlparse(attrs[href_key])
    if p.netloc not in settings.NOFOLLOW_EXCEPTIONS:
        # Before we add the `rel="nofollow"` let's first check that this is a
        # valid domain at all.
        root_url = p.scheme + "://" + p.netloc
        try:
            response = requests.head(root_url)
            if response.status_code == 301:
                redirect_p = urlparse(response.headers["location"])
                # If the only difference is that it redirects to https instead
                # of http, then amend the href.
                if (
                    redirect_p.scheme == "https"
                    and p.scheme == "http"
                    and p.netloc == redirect_p.netloc
                ):
                    attrs[href_key] = attrs[href_key].replace("http://", "https://")

        except ConnectionError:
            return None

        rel_key = (None, u"rel")
        rel_values = [val for val in attrs.get(rel_key, "").split(" ") if val]
        if "nofollow" not in [rel_val.lower() for rel_val in rel_values]:
            rel_values.append("nofollow")
        attrs[rel_key] = " ".join(rel_values)

    return attrs

html = bleach.linkify(text, callbacks=[custom_nofollow_maker])

This basically taking the default nofollow callback and extending it a bit.

By the way, here is the complete code I use for sanitizing and linkifying blog comments here on this site: render_comment_text.

Caveats

This is slow because it requires network IO every time a piece of text needs to be linkified (if it has domain looking things in it) but that's best alleviated by only doing it once and either caching it or persistently storing the cleaned and rendered output.

Also, the check uses try: requests.head() except requests.exceptions.ConnectionError: as the method to see if the domain works. I considered doing a whois lookup or something but that felt a little wrong because just because a domain exists doesn't mean there's a website there. Either way, it could be that the domain/URL is perfectly fine but in that very unlucky instant you checked your own server's internet or some other DNS lookup thing is busted. Perhaps wrapping it in a retry and doing try: requests.head() except requests.exceptions.RetryError: instead.

Lastly, the business logic I chose was to rewrite all http:// to https:// only if the URL http://domain does a 301 redirect to https://domain. So if the original link was http://bit.ly/redirect-slug it leaves it as is. Perhaps a fancier version would be to look at the domain name ending. For example HEAD http://google.com 301 redirects to https://www.google.com so you could use the fact that "www.google.com".endswith("google.com").

UPDATE Oct 10 2018

Moments after publishing this, I discovered a bug where it would fail badly if the text contained a URL with an ampersand in it. Turns out, it was a known bug in Bleach. It only happens when you try to pass a filter to the bleach.Cleaner() class.

So I simplified my code and now things work. Apparently, using bleach.Cleaner(filters=[...]) is faster so I'm losing that. But, for now, that's OK in my context.

Also, in another later fix, I improved the function some more by avoiding non-HTTP links (with the exception of mailto: and tel:). Otherwise it would attempt to run requests.head('ssh://server.example.com') which doesn't make sense.

Inline scripts in create-react-app 2.0 and CSP hashes

October 5, 2018
0 comments Web development, JavaScript, React

UPDATE (1)

My understanding of how to generate the CSP nonces was wrong. What I initially posted was a confusion between nonces and hashes. Sorry. The blog post has been updated to use hashing.

UPDATE (2)

Shortly after publishing this I changed my mind entirely. I decided I don't want any inline scripts no matter how small. Reasons are: 1) with HTTP2 it's cheap to send another file and thus that critical precious first HTML document becomes smaller and 2) when you load it as an external you have the power to load it async if it's applicable.

Check out this new script, it's hackish but works: uninline_scripts.js

UPDATE (Oct 18, 2018)

If you use INLINE_RUNTIME_CHUNK=false yarn run build no scripts, independent of size, are inlined. See this pull request for details.

END UPDATES

I have an app that is hosted on github-pages and because I can't control Content Security Policy HTTP headers I have to do it with a <meta http-equiv="Content-Security-Policy" content="${csp}"> tag in the HTML. That's working fine and the way I do it is that I have a script that looks like this:


#!/usr/bin/env node
const fs = require("fs");
const crypto = require("crypto");

const CSP_TEMPLATE = `
default-src 'none';
connect-src 'self' kinto.workon.app peterbecom.auth0.com;
frame-src peterbecom.auth0.com;
img-src 'self' avatars2.githubusercontent.com https://*.googleusercontent.com;
script-src 'self'%SCRIPT_HASHES%;
style-src 'self' 'unsafe-inline';
font-src 'self' data:;
manifest-src 'self'
`.trim();

const htmlFile = process.argv[2];
if (!htmlFile) throw new Error("missing file argument");
let html = fs.readFileSync(htmlFile, "utf8");

let hashes = "";
let csp = CSP_TEMPLATE;
const matches = html.match(/<script>.*<\/script>/g);
if (matches) {
  matches.forEach(scriptTag => {
    const hash = crypto.createHash("sha256");
    hash.update(scriptTag.replace(/<script>/, "").replace("</script>", ""));
    const digest = hash.digest("hex");
    hashes += ` 'sha256-${digest.toString("base64")}'`;
  });
}
csp = csp.replace(/%SCRIPT_HASHES%/, hashes);

const metatag = `
  <meta http-equiv="Content-Security-Policy" content="${csp}">
`
  .replace(/\n/g, "")
  .trim();
if (html.search(metatag) > -1)
  throw new Error("already has CSP metatag in HTML");
const anchor = '<meta charset="utf-8">';
const newHtml = html.replace(anchor, `${anchor}${metatag}`);
fs.writeFileSync(htmlFile, newHtml, "utf8");

Laugh all you like at my hurried node scripting but it works. It finds any <script>ANYTHING</script> tags (which means it disregards any <script src="... tags), calculates a sha256 hash string out of it and then puts that into the CSP block.

The output becomes something like this:


<!DOCTYPE html>
<html lang="en">
  <head>
    <meta charset="utf-8">
    <meta 
      http-equiv="Content-Security-Policy" 
      content="default-src 'none';script-src 'self' 'sha256-bb84aa7f904e73495b9e99f08531053f3a86f3c1b2e232e3abbac252bf723f1f';">
  </head>
  <body>
    ...
    <script>....</script>
  </body>
</html>

I don't know if I've done it right but at least what didn't use to work now works; the page loads in my browsers now.